
Aperiodic: Democratizing Crypto Order Flow, Liquidity & Market Microstructure Metrics
What 200+ Terabytes of Tick Data Looks Like When It's Actually Useful


It’s a big day for us: we’re opening Aperiodic and our whole data catalog for the public.
It’s been long time in the making. We’ve been customers to all crypto data platforms and came out disappointed with the quality and variety of offering. For anyone who’s remotely serious trying to build quantitative strategies, you need:
Point-in-time data
Basic and advanced liquidity metrics (slippage, bid/ask price twap/vwap, top-of-the-book and deep aggregate order book liquidity)
A large variety of unique market microstructure metrics that describe the state of the market well - (Run imbalance, small / larger order flow volume,
Full exchange coverage without survivorship bias
Local-timestamped versions of all time series
You may get the maximum of 1 or 2 of these with the existing providers - and all with Aperiodic.

What’s in it?
Over the last couple of years, we’ve run hundreds of queries on L1, L2 data to test hypotheses around what kind of metrics could have alpha. We’re opening up the whole market microstructure catalog to the public.
Unlike others, Aperiodic gives you full history for your subscription price.
A couple of unique metrics available that’s not offered elsewhere:
Deep L2 Imbalances — Bid/ask quantity imbalance aggregated across multiple order book depths (5, 10, 20, 25 levels), rather than just the top of book.
Flow Entropy — A Shannon entropy measure applied to the distribution of buy and sell trade arrivals over a window, quantifying how “disordered” or unpredictable the order flow is. Low entropy signals a structured, directional market where trend-following strategies tend to be more effective, while high entropy reflects choppy, mean-reverting conditions where directional signals break down.
Slippage — The realized cost of executing a market order against the live L1 order book.
Kyle lambda — An empirical estimate of Kyle’s λ, measuring price impact per unit of signed order flow.
Large trade reversal — A metric capturing how much of the price move driven by a large aggressive trade subsequently reverts within the interval — distinguishing informed flow (which produces permanent impact) from uninformed or liquidity-driven flow (which mean-reverts).
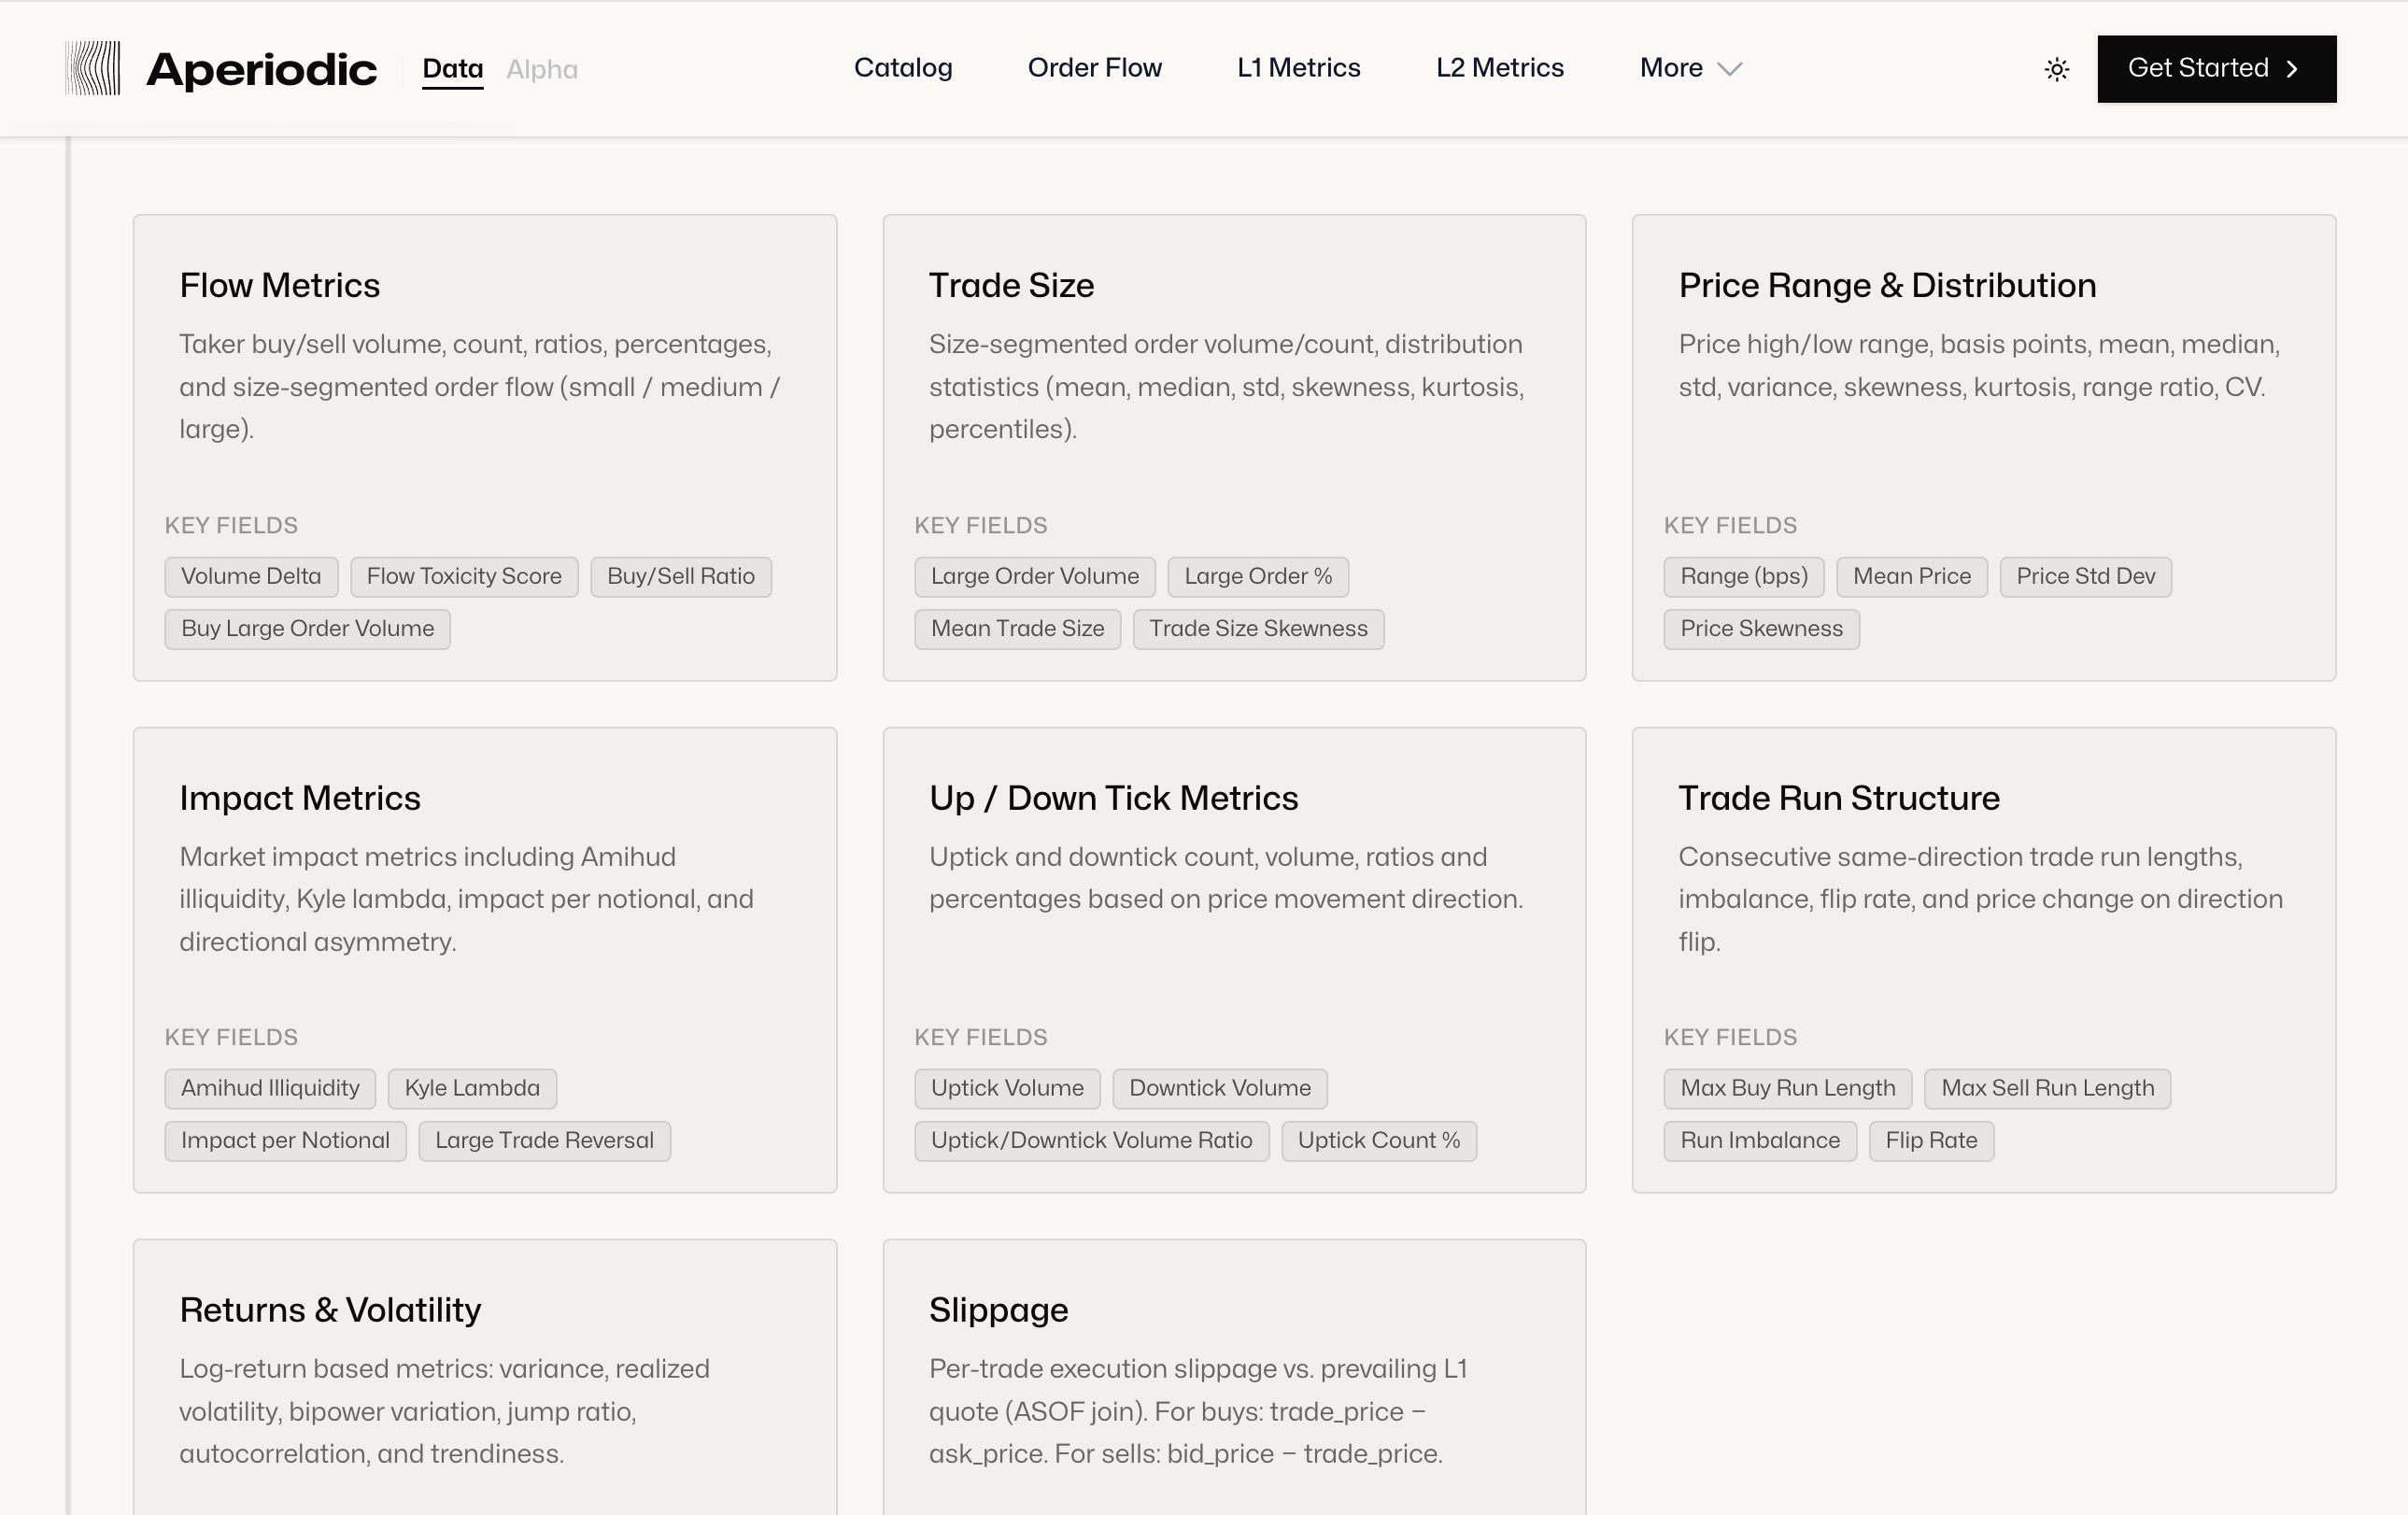
Browse more than 100+ metrics over here!
The most convenient data interface we could imagine
Aperiodic is designed for the you: the API returns pre-signed URLs of ready-to-use parquet files that you can download with arbitrary concurrency (no rate limits), instead of an arbitrary format that you’d need to parse & figure out how to store.
We released a lightweight python wrapper here as well.
Download all historical data for a set of metrics for all symbols in a couple of lines of code.
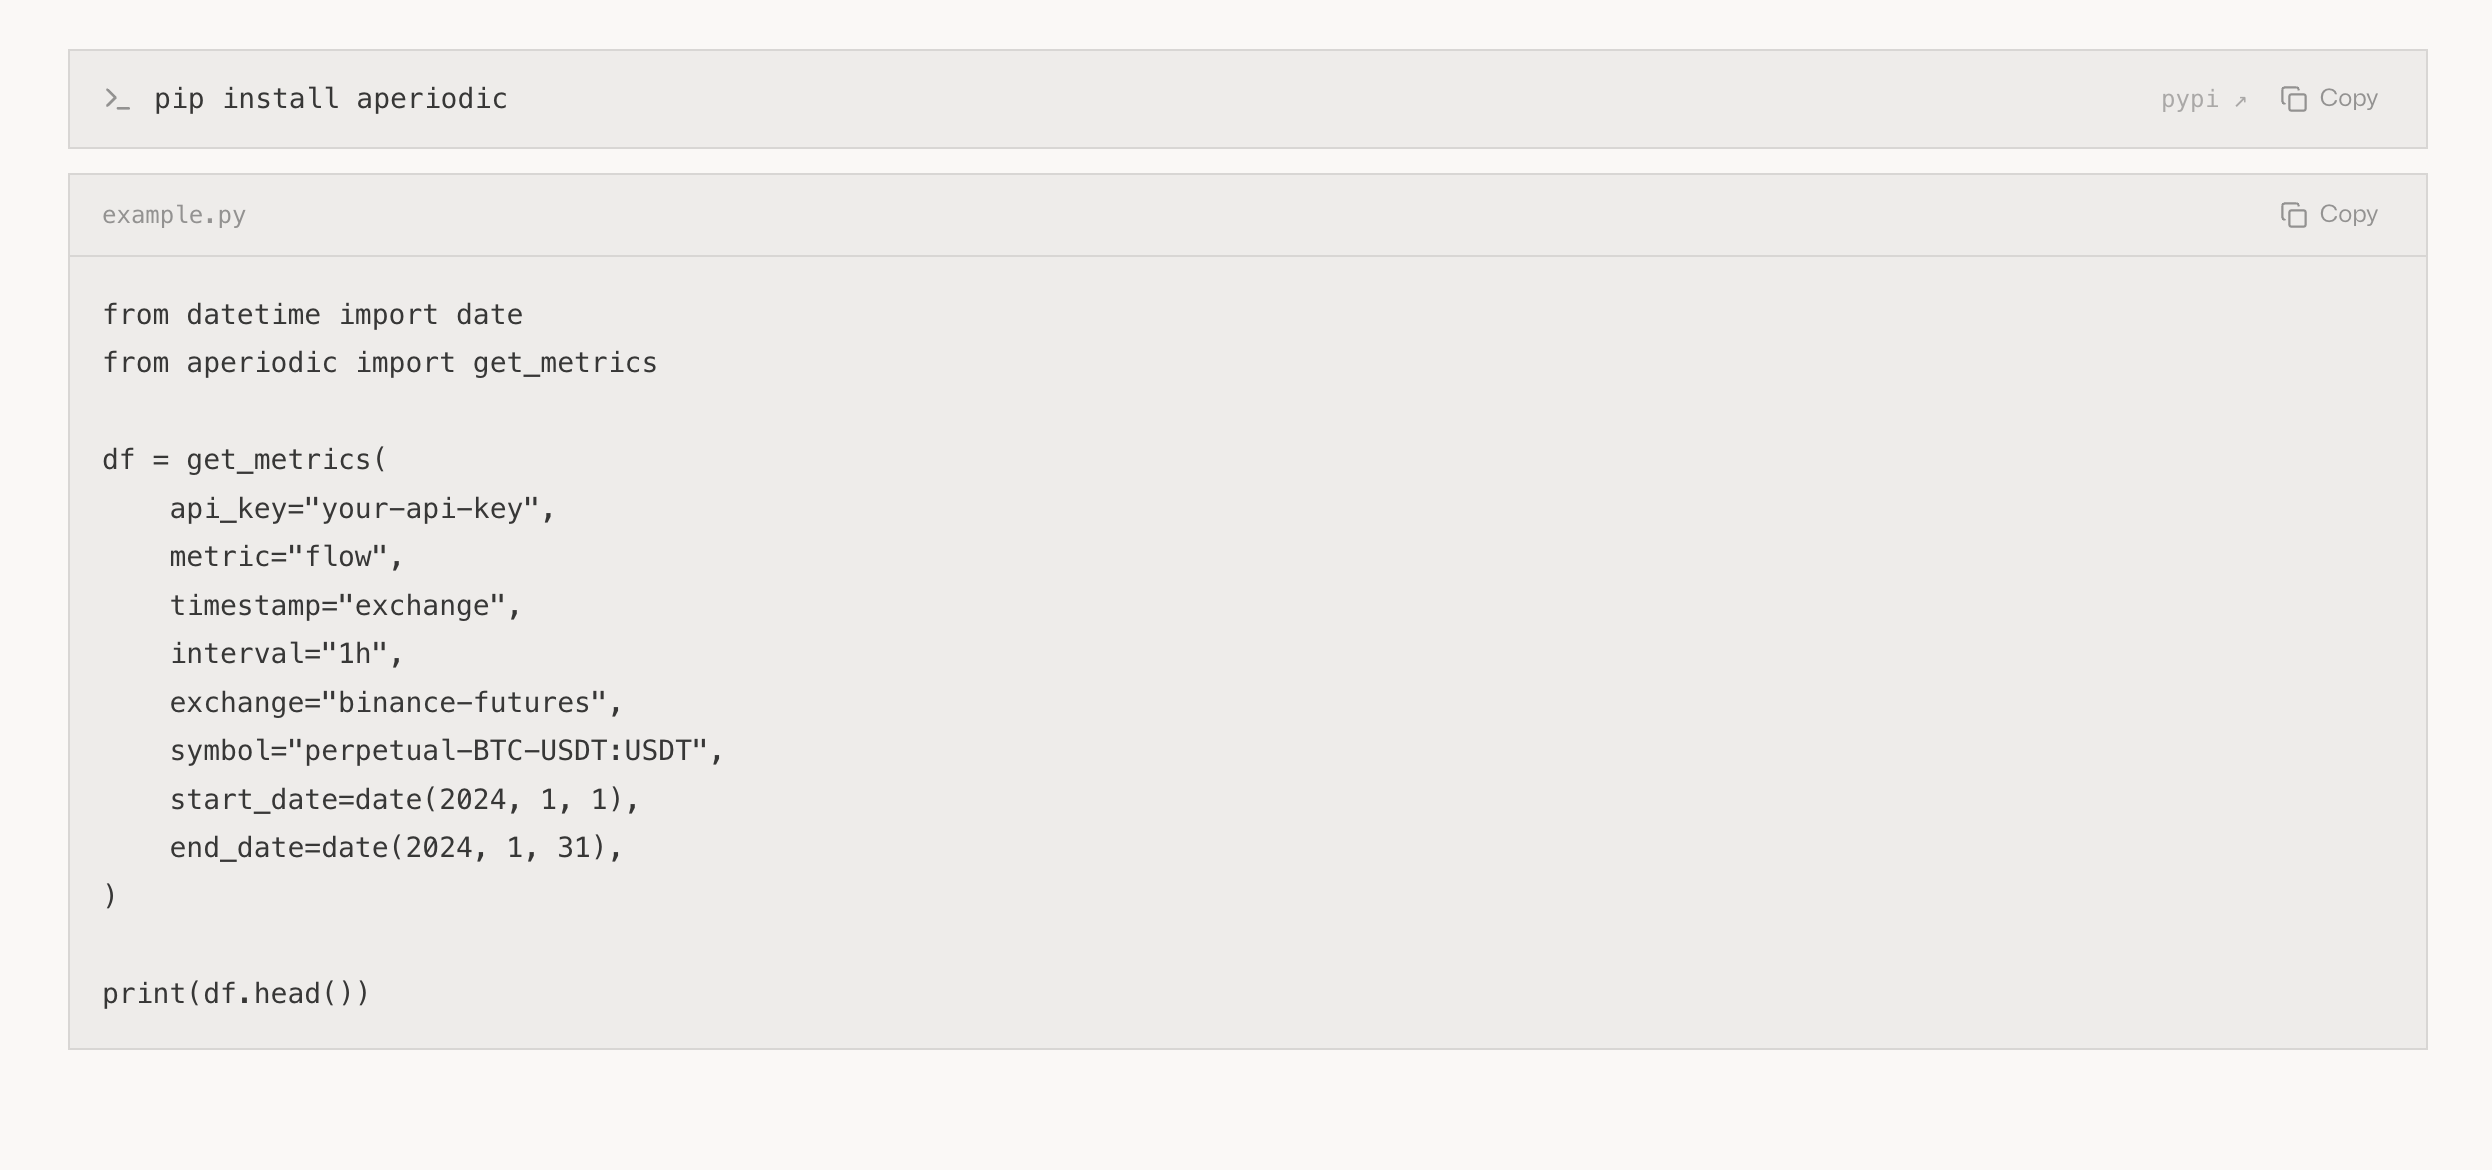
We also offer direct Object Store bucket access for yearly Prime subscribers.
Data infrastructure you don’t have to build
Over the last couple of years, we’ve ingested hundreds of Terabytes of crypto market data, and built a very effective infrastructure that lets us query it in any way imaginable.
The only alternative up until today to access these metrics are:
buy raw tick / L2 data (very expensive)
figure out a way to store it (could be even more expensive)
query it (expensive, weeks of work)
keep it up-to-date (months of work)
Paying tens of thousands of dollars in the process to cloud providers and for a small team of experienced data engineers.
Aperiodic will get you access to these metrics so you can focus on your research & analysis from day 1, instead of spending months on data engineering pipelines.
What would you like to see next?
We maintain an collaborative, ambitious roadmap and very much welcome your feedback on the most useful additions: Aperiodic Roadmap.
Please shoot us a message if you have any ideas (metrics, delivery methods, etc.) you’d like to see here.
We hope Aperiodic expands your access to data that was previously out of reach; to celebrate the launch, we’re offering 40% off annual subscriptions!